
TL;DR
Acceptable Quality Limit (AQL) tables are a vital tool in quality control, providing a standardized statistical method to determine if a production batch meets your quality standards without inspecting every single item. By understanding AQL tables for beginners, you can confidently decide the sample size to inspect and the maximum number of defects allowed before rejecting an entire order. The process involves using your total order size (lot size) and a chosen inspection level to find a code letter, which then points to the exact sample size and accept/reject numbers on a second chart.
What is AQL (Acceptable Quality Limit)?
The Acceptable Quality Limit, commonly known as AQL, is a statistical sampling standard used for product inspections. It defines the worst tolerable quality level for a batch of goods. In simple terms, it’s a pre-negotiated threshold that specifies the maximum percentage of defective units that can be accepted in a production lot. If the number of defects found in a random sample is below this limit, the entire batch is accepted; if it’s above, the batch is rejected. This method allows businesses to manage quality without the prohibitive cost and time of inspecting 100% of their products.
AQL is not about aiming for defects; it’s about managing risk. Every manufacturing process has some level of variation, making a zero-defect rate difficult to achieve consistently. AQL provides a clear, objective, and internationally recognized framework (based on standards like ISO 2859-1) for both buyers and suppliers to agree on what is ‘good enough’. This clarity is crucial for maintaining strong supplier relationships and ensuring consistent product quality that meets customer expectations.
The application of AQL is fundamental for effective cost management and supply chain integrity. By catching quality issues before a shipment leaves the factory, companies can prevent financial losses from unsellable goods, returns, and damage to their brand’s reputation. Especially when sourcing from overseas, having a trusted partner on the ground is invaluable. For instance, companies that provide a full range of quality control services can act as your eyes in the factory, ensuring standards are met before shipment. This proactive approach to quality control is a cornerstone of modern manufacturing and retail.
Decoding the AQL Table: Key Components Explained
Before you can use an AQL table, it’s essential to understand its core components. These tables might seem complex at first, but they are logically structured to guide you to a statistically valid sampling plan. The main elements you’ll need to identify are the lot size, inspection levels, and the AQL percentages for different defect types.
First, you have the Lot Size, which is simply the total quantity of units in the production batch you are inspecting. Next are the Inspection Levels, which determine the rigor of the inspection by influencing the sample size. There are two main types:
- General Inspection Levels (GI, GII, GIII): These are used for most product inspections. GII is the most common standard, providing a good balance of rigor and cost. GI requires a smaller sample size (less stringent), while GIII requires a larger one (more stringent).
- Special Inspection Levels (S-1, S-2, S-3, S-4): These involve much smaller sample sizes and are typically reserved for specific tests that might be destructive or very time-consuming.
Finally, you must define your AQL percentages based on Defect Classification. Defects are not all equal, so they are typically categorized by severity:
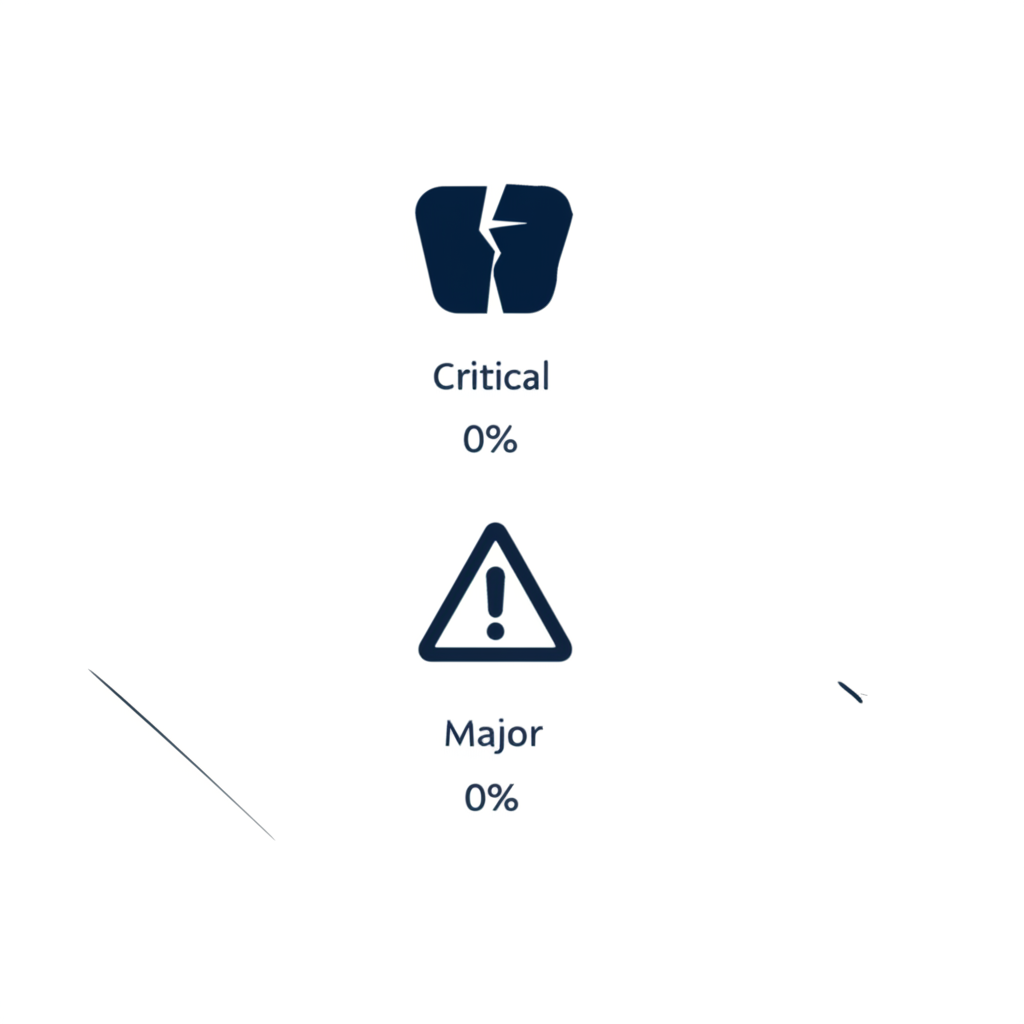
- Critical Defects (AQL 0%): A defect that poses a safety risk to the user or fails to meet mandatory regulations. There is zero tolerance for critical defects; even one will cause the entire batch to fail inspection.
- Major Defects (AQL 2.5% is common): A defect that is likely to result in product failure, significantly reducing its usability or saleability. A common AQL for major defects is 2.5%.
- Minor Defects (AQL 4.0% is common): A small imperfection that deviates from the standard but is unlikely to affect the product’s function or be a reason for a customer to return it. A typical AQL for minor defects is 4.0%.
These percentages are not fixed and should be agreed upon with your supplier based on the product type, market expectations, and brand positioning.
How to Read an AQL Table: A Step-by-Step Guide
Using AQL tables involves a straightforward, two-table process. By following these steps, you can quickly determine your required sample size and the accept/reject criteria for your inspection. Let’s walk through it with an example: imagine you have ordered a lot of 8,000 units.
- Determine Your Lot Size and Choose an Inspection Level.
Your lot size is 8,000 units. For most consumer goods, the standard choice is General Inspection Level II (GII). This is the default for a reason, as it offers a balanced inspection plan. - Find Your Sample Size Code Letter in Table 1.
Look at the first AQL table (often labeled ‘Sample size code letters’). Find the row that corresponds to your lot size (the range ‘3,201 to 10,000’ includes 8,000). Follow this row across to the column for your chosen inspection level, GII. The intersection gives you a code letter. In this case, it is the letter ‘L’. - Use the Code Letter to Find Your Sample Size in Table 2.
Now, move to the second AQL table (often labeled ‘Single sampling plans for normal inspection’). Find the row corresponding to your code letter, ‘L’. The column next to it will show the ‘Sample Size’. For letter ‘L’, the sample size is 200 units. This means you must randomly select and inspect 200 units from your total lot of 8,000. - Find Your Acceptance and Rejection Numbers.
In the same row for code letter ‘L’, look across the columns for the AQL percentages you defined earlier. Let’s assume you set AQL 2.5% for major defects and 4.0% for minor defects.- Under the ‘2.5’ column, you will see two numbers: Ac (Accept) and Re (Reject). For code ‘L’, these are 10 and 11. This means if you find 10 or fewer major defects in your 200-unit sample, you accept the lot. If you find 11 or more, you reject it.
- Under the ‘4.0’ column, the Ac/Re numbers are 14 and 15. This means the lot is acceptable if you find 14 or fewer minor defects, but it must be rejected if you find 15 or more.
By following this process, the AQL table removes guesswork and provides a clear, data-driven basis for your quality control decisions, as detailed in guides from quality experts like 6sigma.us.
Common Mistakes to Avoid When Using AQL Tables
While AQL sampling is a powerful tool, beginners can easily make mistakes that undermine its effectiveness. Avoiding these common pitfalls is crucial for accurate and reliable quality control. By being aware of these issues, you can ensure your inspections yield meaningful results and protect your business from defective products.
- Using the Wrong Sample Size: A frequent error is inspecting too few samples, either due to time pressure or misunderstanding the table. A smaller-than-required sample size does not provide a statistically valid representation of the lot and significantly increases the risk of accepting a bad batch. Conversely, inspecting too many units is inefficient and wastes resources. Always adhere to the sample size indicated by the AQL table.
- Misinterpreting Inspection Levels: Choosing an inspection level that is too lenient (e.g., GI) when a standard level (GII) is needed can let more defects slip through. On the other hand, choosing a level that is too strict (GIII) without justification can lead to unnecessary rejections and friction with your supplier. Stick with GII unless you have a specific, documented reason to change it, such as a supplier’s excellent or poor track record.
- Vague Defect Classification: One of the biggest sources of disputes is a lack of clear, objective definitions for what constitutes a critical, major, or minor defect. What you consider a major flaw, your supplier might see as minor. It is essential to create a detailed defect checklist with visual examples and have it agreed upon by all parties before production begins.
- Inconsistent Sampling Method: The samples pulled for inspection must be chosen completely at random from the entire production lot. Cherry-picking units from the top of a few cartons is not random and can lead to a skewed result. Ensure the inspector is trained to pull samples from various locations throughout the shipment to get an accurate quality snapshot.
Putting AQL into Practice for Better Quality
Understanding and correctly applying AQL tables is more than just a technical exercise; it’s a fundamental business practice for anyone involved in manufacturing or importing goods. It transforms quality control from a subjective debate into an objective, data-driven process. By establishing clear standards with your suppliers, you create a transparent framework that protects your investment, ensures product consistency, and ultimately safeguards your brand’s reputation. Mastering this tool empowers you to make informed, confident decisions about every production run, ensuring the products you sell consistently meet the expectations of your customers.

Frequently Asked Questions
1. How do you read an AQL table?
To read an AQL table, you start by finding your total order quantity (lot size) in the first table and cross-referencing it with your chosen inspection level (usually ‘GII’) to get a sample size code letter. You then take this letter to the second table to find the specific number of units to sample. In that same row, you look under your pre-defined AQL percentage columns (e.g., 2.5% for major defects) to find the maximum number of defects allowed to accept the batch.
2. What are common AQL mistakes?
The most common mistakes include using the wrong sample size (either too small or too large), choosing an inappropriate inspection level, having unclear definitions of what constitutes a major or minor defect, and not selecting samples randomly from the entire production lot. Any of these errors can lead to inaccurate inspection results and poor quality control decisions.
3. Can you explain the use of an AQL chart?
An AQL chart (or table) is a tool used to standardize the sampling process for quality inspections. Its primary use is to determine a statistically valid sample size to inspect from a larger production batch and to provide clear accept/reject criteria based on the number of defects found. It helps buyers and sellers agree on quality standards without having to inspect 100% of the products, saving time and money while managing risk.
4. How do you calculate AQL manually?
You don’t typically ‘calculate’ the AQL value itself manually during an inspection; you select a desired AQL percentage (e.g., 1.0%, 2.5%) beforehand as part of your quality standard. The AQL tables are then used to find the resulting sample size and the specific number of defects that correspond to your chosen AQL. The manual part is the process of using the two tables to cross-reference your lot size and AQL percentage to get these numbers, not a mathematical formula.

